 NERC Data Catalogue Service
Water flooding
Type of resources
Topics
Keywords
Contact for the resource
Provided by
Years
Formats
Representation types
Update frequencies
Scale
-

Each contains two columns of data representing the UTM coordinates of the centre line of the Rio Beni in Bolivia. These coordinates were derived by digitising Landsat imagery and aerial photographs (1960 only). The number in the file name after "banks_c" corresponds to the year. Numbers in column 1: UTM Zone 19S Easting Numbers in column 2: UTM Zone 19S Northing
-
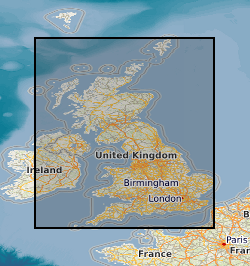
The groundwater flooding susceptibility data shows the degree to which areas of England, Scotland and Wales are susceptible to groundwater flooding on the basis of geological and hydrogeological conditions. It does not show the likelihood of groundwater flooding occurring, i.e. it is a hazard not risk-based dataset. The data covers Great Britain in a consistent manner. It will be updated periodically (at least bi-annually) as the underlying datasets or the methodology to derive the groundwater flooding susceptibility data are improved. The data is based on data sets with a range of resolutions, but the derived data set has an effective spatial resolution of about 50m by 50m. The susceptibility data is suitable for use for regional or national planning purposes where the groundwater flooding information will be used along with a range of other relevant information to inform land-use planning decisions. It might also be used in conjunction with a large number of other factors, e.g. records of previous incidence of groundwater flooding, rainfall, property type, and land drainage information, to establish relative, but not absolute, risk of groundwater flooding at a resolution of greater than a few hundred metres. In all cases it is strongly recommend the confidence data is used in conjunction with the groundwater flooding susceptibility data. The susceptibility data should not be used on its own to make planning decisions at any scale, and, in particular, should not be used to inform planning decisions at the site scale. The susceptibility data cannot be used on its own to indicate risk of groundwater flooding.
-
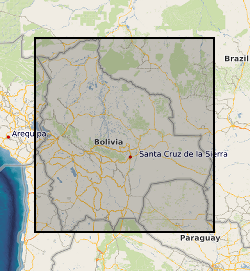
Each file contains four columns of data representing: column 1: UTM Zone 19S Easting coordinate for survey location along the Rio Beni, Bolivia. column 2: UTM Zone 19S Northing coordinate for survey location along the Rio Beni, Bolivia. column 3: Measurment range from observer to bank in m column 4: Bank height in m (the difference between bank top and low flow water level) UTM coordinates were measured using a Trimble Global Position System with OmniSTAR HP correction Measurement range and bank height were measured using a GPS supported laser range finder (Impulse 200 LR< Laser Technology inc) Survey 1 was carried out between 15th and 19th September 2011, when the flow discharge within the Beni was in the range 453-530 cumecs Survey 2 was carried out between 20th and 23rd September 2011, when the flow discharge within the Beni was in the range 762-892 cumecs
-

These files contain Electric Resistivity Ground Imaging (ERGI) data measured using a Tigre 128 electric resistivity system with 64 electrodes in a roll-along survey mode. The electrodes were spaced 5 m apart and used in a Wenner a array configuration. The format of the file names is as follows: The two digits following B (18 or 20) is a label indicating the measurement site The digit following the T (1, 2 or 3) is the measurement transect number The next six digits, following the underscore, are the measurement date (ddmmyy) The next two digits, following the second underscore, are the survey number (measurements were repeated multiple times) The files are in tab delimited ascii text format, with three columns of data: Column 1 contains the distance measured across the survey transect Column 2 contains the a-spacing (the distance between adjacent electrode pairs) in m Column 3 contains the measured apparent resistivity value in Ohm m
-

The data in this file represent measurements of the the depth, grain size characteristics and sedimentation rate for sediment cores collected from the floodplain of the Rio Beni in 2011, 2012, and 2013. The age of floodplain sediments was determined from measurements of the Pb-210 activity of floodplain sediments within the cores. The sample collection and laboratory techniques and data analysis procedures used to obtain these data are described in: Aalto, R & Nittrouer, C.A. (2012) Phil. Trans. Royal. Society., vol 370, p 2040-2074. This is an ascii text comma delimited file. Each row in the file represents a sediment core. The file contains 12 columns of data representing: column 1: The core name column 2: The latitude of the core location in digital degrees column 3: The longitude of the core location in digital degrees column 4: The year in which the core was collected column 5: The depth of the floodplain core (in cm) column 6: The age of the oldest sediment in the core (in years) column 7: The depth to the oldest sediment in the core (in cm) column 8: The estimated mean sedimentation rate for the core (in cm per year) column 9: The percentage of the core comprised of clay column 10: The percentage of the core comprised of silt column 11: The percentage of the core comprised of sand column 12: The mean density of sediment in the core (in g per cubic cm)